Chapter 10. Visualizing How the Power Law Model Works to Model Bitcoin Adoption
This chapter focusses on developing a visual understanding of how the Power Law works to model Bitcoin-containing address count and market cap
10.1 Summarizing Chapter 6, 7, 8 and 9 Conclusions about the Power Law.
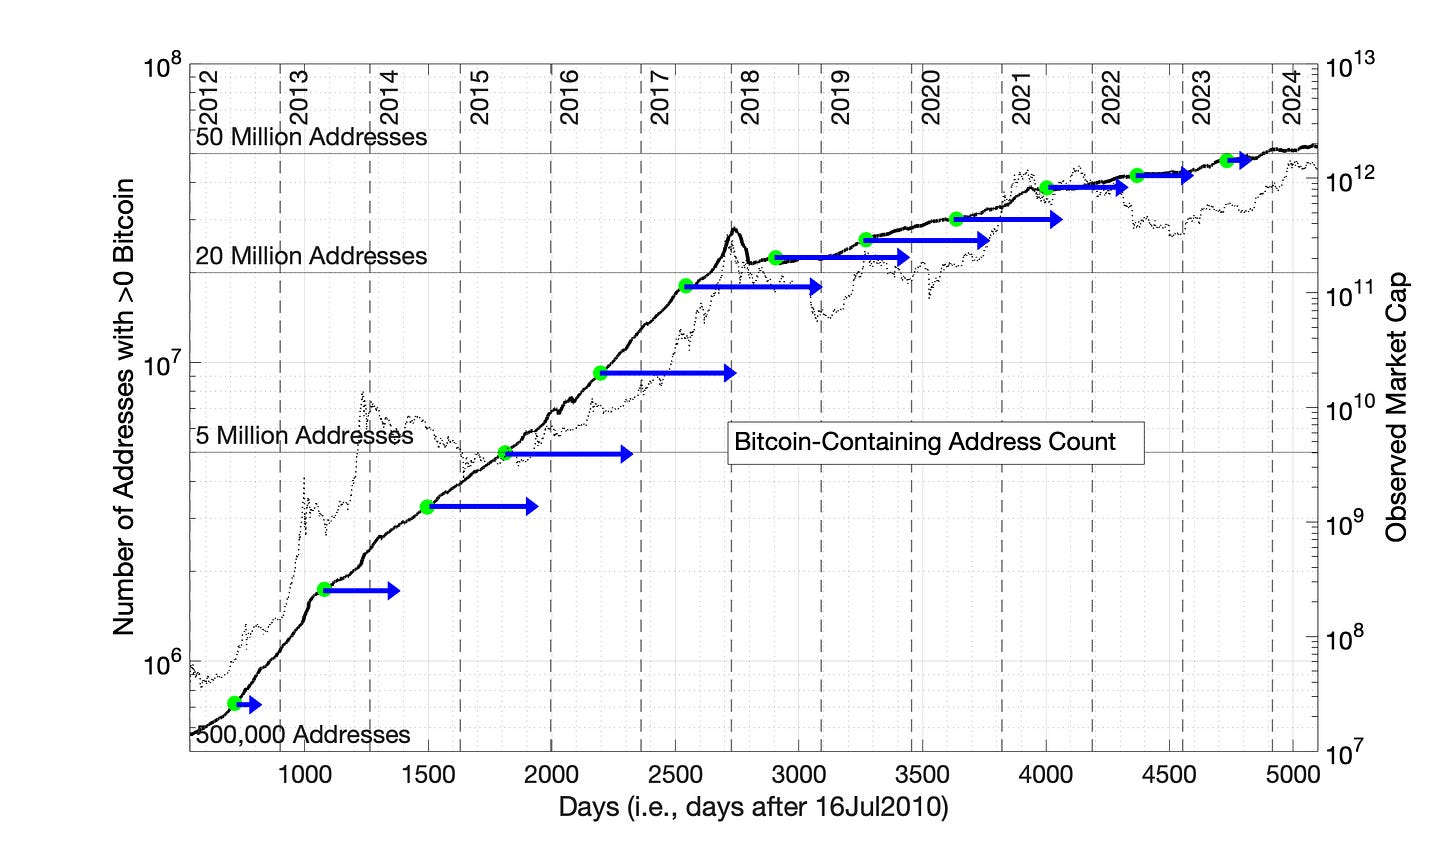
The shape of technology adoption curves when plotted semilog versus time is upward with a declining annual increase — like Fig 10.1, the adoption curve for Bitcoin-containing address count.
The Power Law model is a powerful mathematical approach to convert the natural curvature of technology adoption into a linear plot. From this linear plot, a model equation such as ln(market cap) = m*ln(elapsed time) + b is obtained, where m and b are constants.
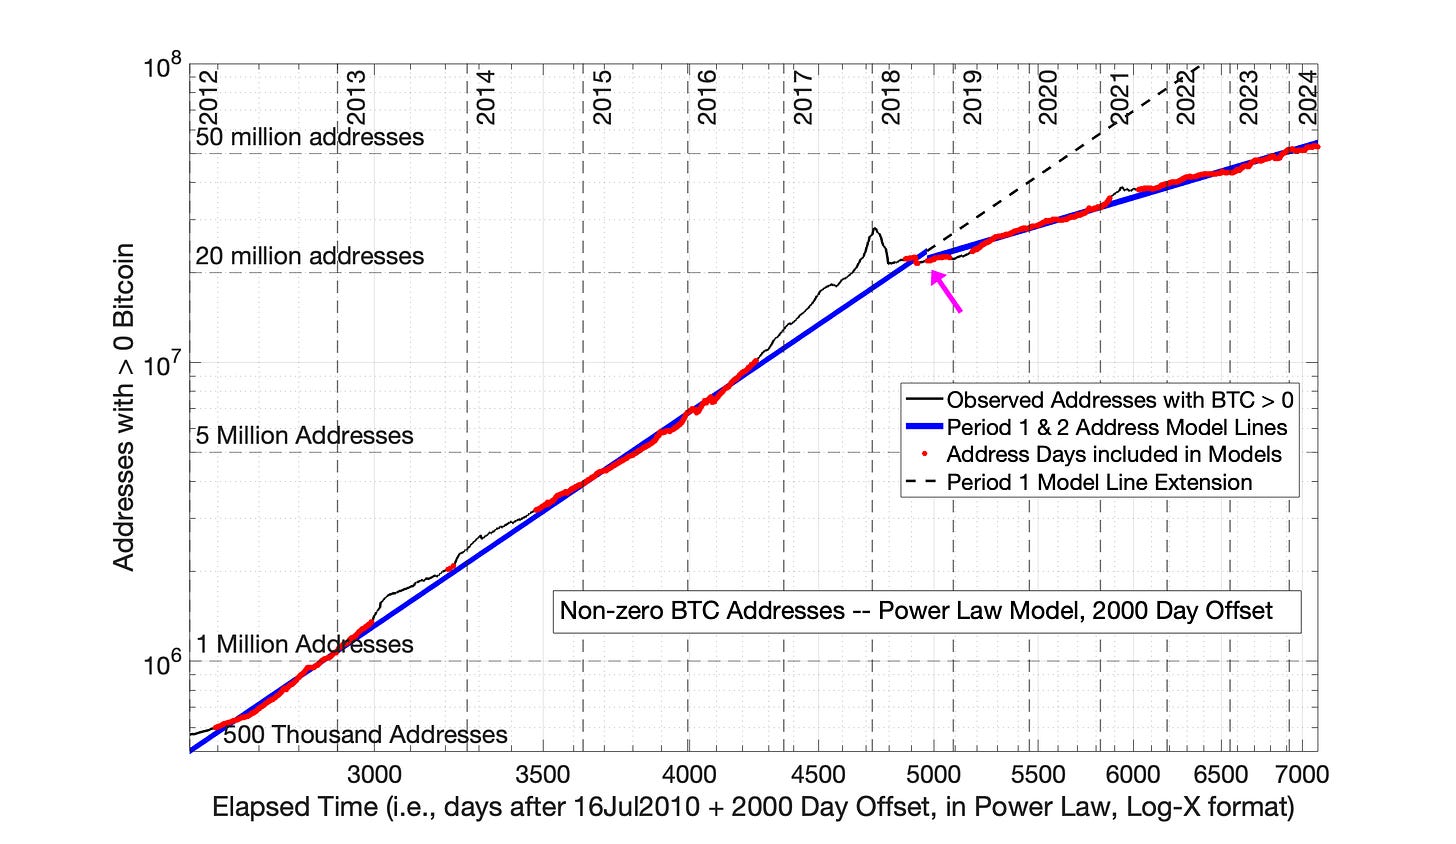
When the Power Law model is properly applied, individual technology adoptions typically resolve into a series of distinct linear periods — like Fig 10.2, the log-log plot of Bitcoin-containing address count versus the log of elapsed time.
Fig 10.2 shows 2 distinct adoption periods: Period 1, from 2012 to mid-2018 and Period 2, from mid-2018 to present (Fig 10.2).
Over the 20 to 40 year history of a typical technology adoption, 3 or 4 adoption periods are often evident in Power Law plots (Chapters 6 and 7).
When the Power Law is properly applied, the final solution shows a smooth transition between individual adoption periods, like the smooth transition between Period 1 and Period 2 in Fig 10.2 (indicated by the magenta arrow in Fig 10.2).
The correct solution of the Power Law model was shown in 16 of 16 historic technology adoptions to also match the results of a sister model, the Square Root of Elapsed Time (SRET) model. (Chapters 6 through 9)
The two adoption periods of Power Law model solution of Fig 10.2 confirm what we can see with our eyes when viewing Fig 10.1 — something happened in 2018 which reduced the rate at which new Bitcoin-containing addresses were created. There are alternative measures of Bitcoin network size that show the same decrease in growth rate in 2018 (Chapter 8).
The Power Law approach can be too powerful/intense in moving individual data points in the attempt to create data linearity, translating the concave shape of the semilog adoption curve (Fig 10.1) into an aberrant convex Power Law plot. (Chapter 7).
There is a simple and effective fix to this problem, the Power Law time offset. Days or years are added to the actual elapsed time values. For example, for Fig 10.2, a time offset of 2000 days means: Day 1 of Bitcoin price history becomes Day 2001 for model calculations, Day 534 becomes Day 2534, Day 5099 becomes Day 7099. The magnitude of the time offset is a tunable parameter to regulate the intensity of the Power Law model (Chapters 7, 8 and 9).
The addition of the time offset to the Power Law model is equivalent to changing the Power Law operating equation to be
ln(market cap) = m*ln(elapsed time + time offset) + b or.
ln(Bitcoin-containing addresses) = n*ln(elapsed time + time offset) + d
where m,n, b, d and the time offset are constants
No information is lost by application of this time offset. We know which actual date in time corresponds to each model day. With a time offset of 2000 days, Day 2001 is 17Jul2010.
Note: I will be adding a section to this chapter showing how the Square Root of Elapsed Time (SRET) model works to model technology adoptions, including Bitcoin. As shown in Chapters 8, 9, and 11, it is very similar to the Power Law with a 2000 day offset. That is, the Power Law and Square Root of Time models work by the same basic mechanism. The Power Law is just more powerful, and frequently requires a positive time offset value to reduce its intensity.
Fig 10.1 Semilog plots of the number of Bitcoin-containing addresses and Bitcoin market cap vs. elapsed time. Market capitalization in USD is plotted for (in black), with reference to the values on the right Y-axis. Day 1 is set as 17Jul2010, the first day of Bitcoin price history in the Glassnode database.
Fig 10.2 Bitcoin-Containing Addresses: Power Law model equation (2000 day time offset) Bitcoin-containing address count was shown in Chapter 8 to be a reasonable metric for Bitcoin network size. This is the optimized version of the Power Law model for Bitcoin-containing addresses from Chapter 8 (See Figures 8.9 and 8.10). The Power Law with 2000 day (5.5 year) time offset results in a smooth transition between the solid blue lines representing the model equations Periods 1 and 2. Other figures notes:
Red data points were the basis of the least-squares fits for the Power Law model equations.
Solid blue lines are the Power Law model lines: Period 1, before mid2018, and Period 2, after mid-2018
Magenta arrow points at smooth transition between Period 1 and Period 2.
The dashed black line is the extension of the Period 1 line into the future, included to provide a visual reference for the change in adoption rate that occurred in mid-2018.
10.2 Visualizing Power Law Model Success and Failure: Bitcoin-containing Addresses
The successful application of the Power Law model in Fig 10.2 can be visualized as the horizontal movement of individual data points from Fig 10.1 to Fig 10.2.
The application of the Power Law model to Bitcoin-containing addresses is a good place to start, as this metric exhibits relatively little volatility over time — i.e., 10-fold less volatility that Bitcoin market cap. Most of the Bitcoin-containing address history is within plus-or-minus 5% of the Period 1 and 2 model lines — the days marked in red in Fig 10.2.
In Fig 10.3, twelve individual data points are marked as green dots — July 1 of successive years between 2012 and 2024. The blue arrows indicate how far each data point is moved horizontally to the right to convert the curved semilog plot of Fig 10.1 to the successful Power Law plot of Fig 10.2. The two linear periods of Fig 10.2 can be visualized by laying a ruler across the tips of the arrows in Fig 10.3.
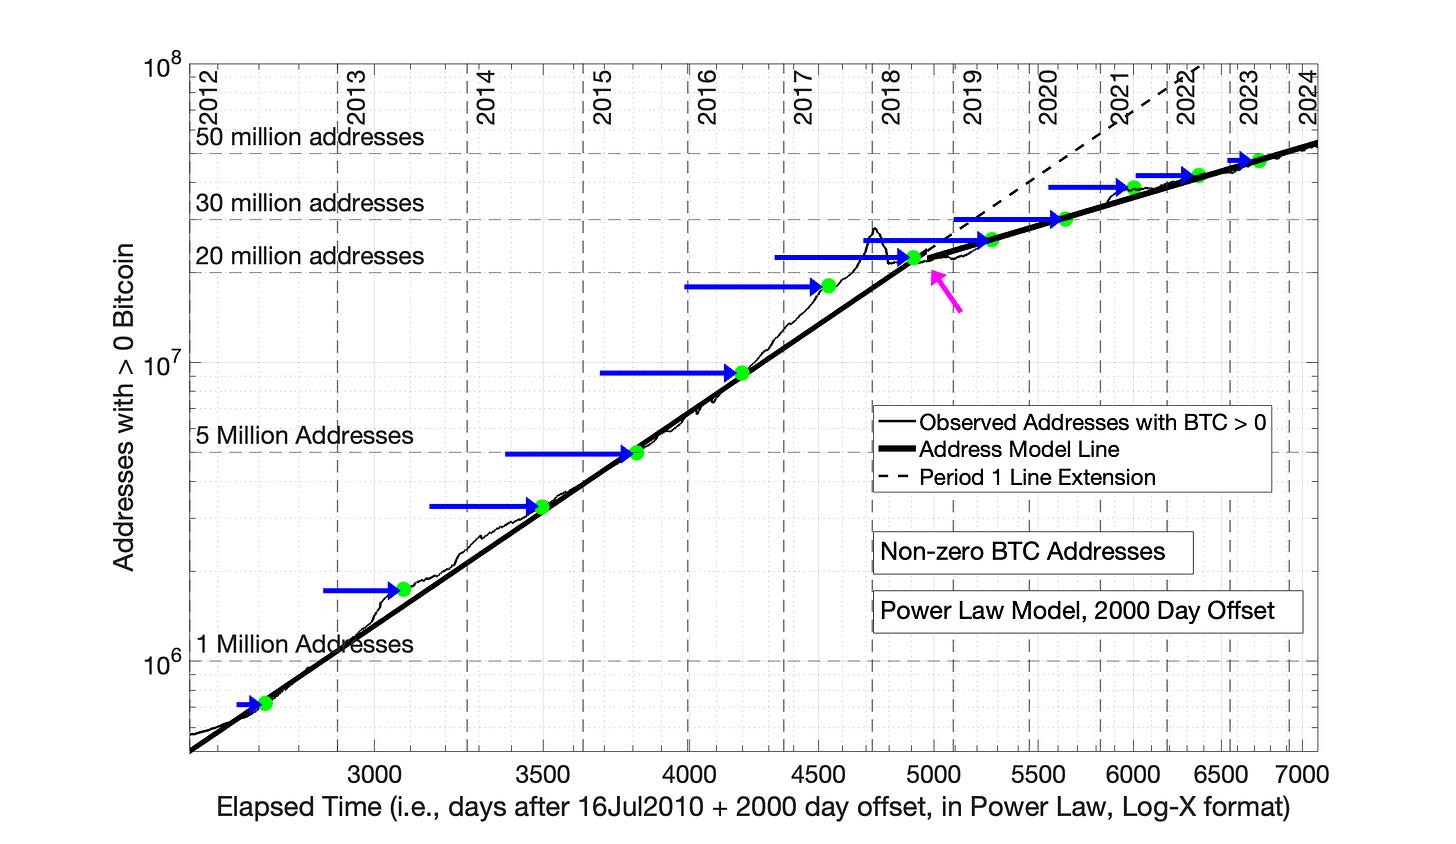
If Fig 10.4, the same translation of semilog data to a successful Power Law model plot is viewed from the other perspective. That is, the blue arrows indicate how far in space each data point has moved from Fig 10.1 to create the Power Law plot Fig 10.2.
Fig 10.3 Power Law Translocation of Bitcoin-Containing Address Data Points to Create Fig 10.2 from Fig 10.1 Twelve data points marked in green are selected across Bitcoin history, on July 1 of successive years. The arrows indicate the precise translocation of these data points from Fig 10.1 to Fig 10.2 by the Power Law model (with 2000 day time offset).
Fig 10.4 Bitcoin-Containing Addresses: Power Law model equation (2000 day time offset) This figure is the complement to Fig 10.3. The arrows show the precise translocation of 12 data points from Fig 10.1 to create Fig 10.2. The magenta arrow shows points at the transition of the Period 1 and Period 2 model lines.
In Fig 10.5, the translocation of Fig 10.1 data is shown for a Power Law model plot with o time offset. The Power Law has moved individual data points much farther to the right. There is no longer continuity between Periods 1 and 2, as shown by the magenta arrow. The Power Law has greatly distorted the relationship of data points. This scenario was previously presented and discussed in Chapter 8 (Figures 8.5 and 8.6).
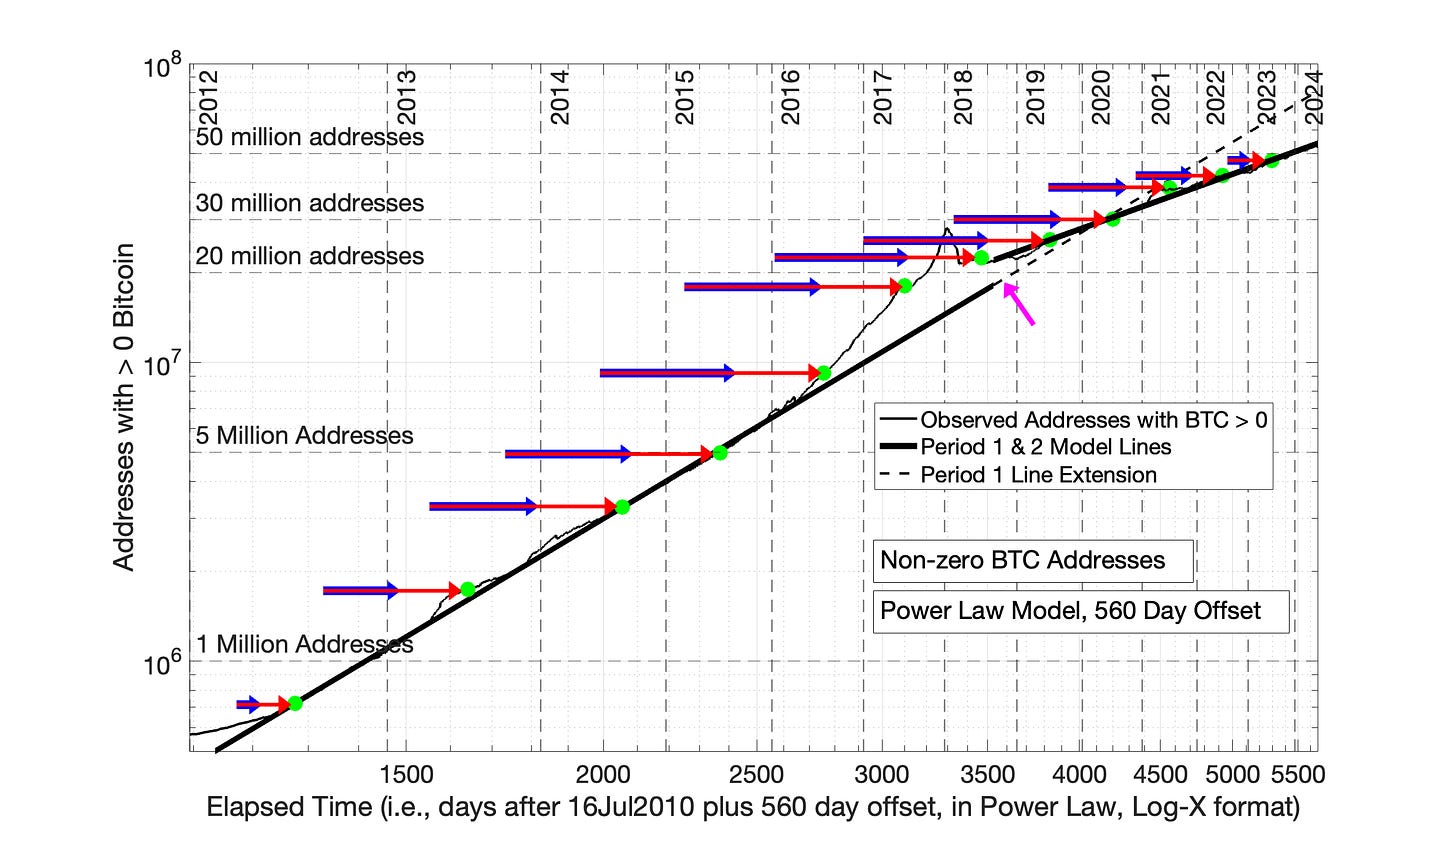
In Fig 10.6, a time offset of 560 days is applied. This offset value is significant, because it is the time offset applied by Giovanni Santostasi and others in the popular Twitter version of the Power Law. This time offset has reduced the data over-adjustment of the standard Power Law. But, there is still much data distortion, and lack of continuity between Periods 1 and 2, as shown by the magenta arrow. This scenario was previously presented and discussed in Chapter 8 (Figures 8.7 and 8.8).
Fig 10.5 Power Law Translocation of Bitcoin-Containing Address Data Points by the Power Law with Zero Time Offset. This figures demonstrates the excessive translocation of data points by the Power Law with zero time offset. The blue arrows indicate the translocation observed in Figures 10.3 and 10.4 to create the optimal solution (Power Law with 2000 day time offset, Fig 10.2). The red arrows show the additional translocation created by the Power Law model with 0 time offset. The magenta arrow points at the massive distortion of data points and loss of data continuity between Periods 1 and 2 created by the Power Law with 0 time offset.
Fig 10.6 Bitcoin-Containing Addresses: Power Law model equation (560 day time offset) Compare Fig 10.6 to Fig 10.5. The Power Law model with 560 day time offset retains significant data distortion and loss of data continuity relative to Fig 10.4. The length of the red arrows relative to the blue arrows is a measure of the amount of data distortion. The magenta arrow points at the discontinuity between the Period 1 and Period 2 model fits. But, the 560 day time offset has reduced the data distortion relative to the Power Law model with no time offset (Fig 10.5).
10.3 Visualizing Power Law Model Success and Failure: Bitcoin Market Cap
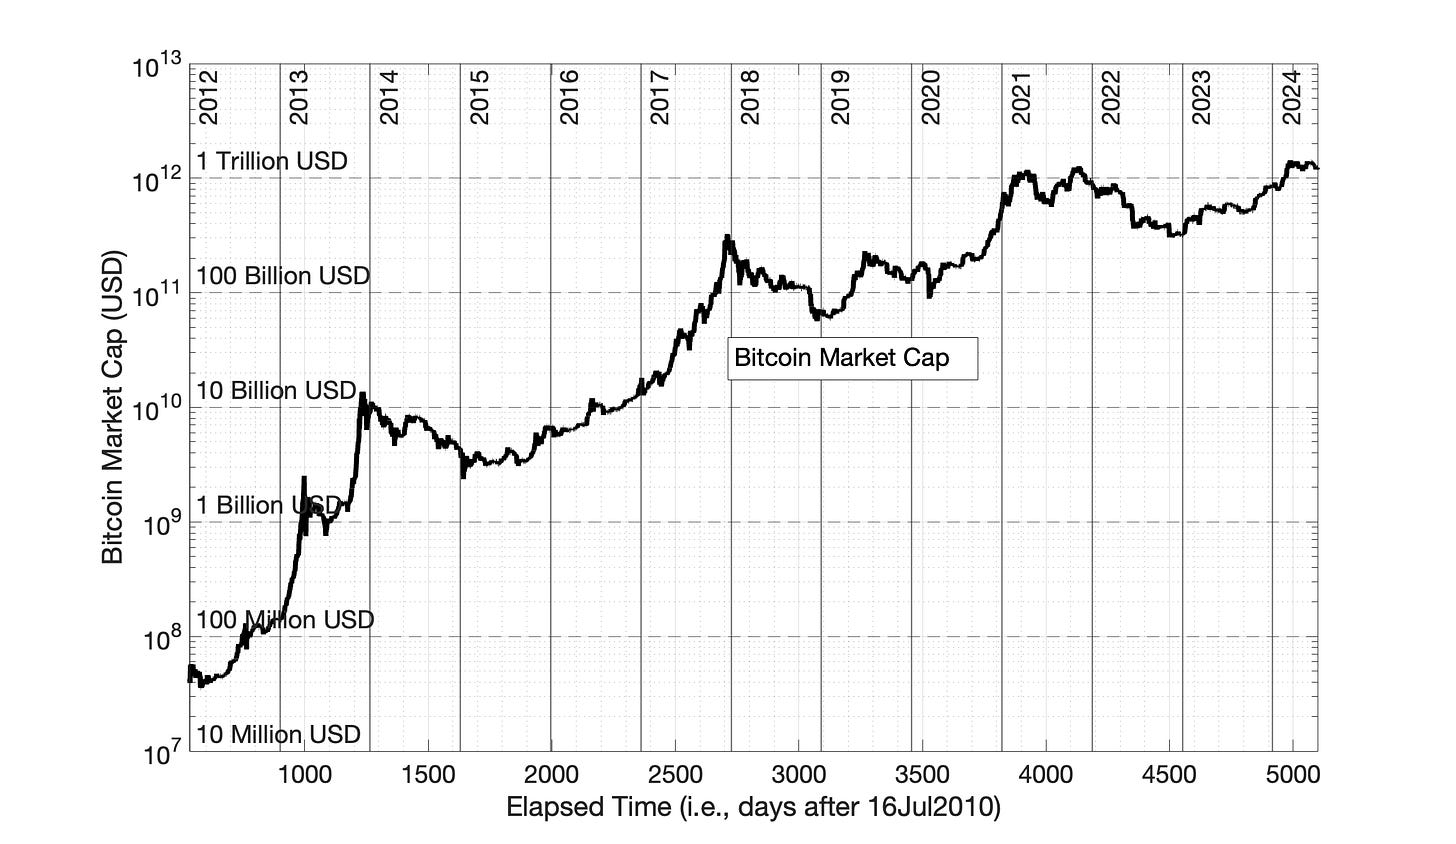
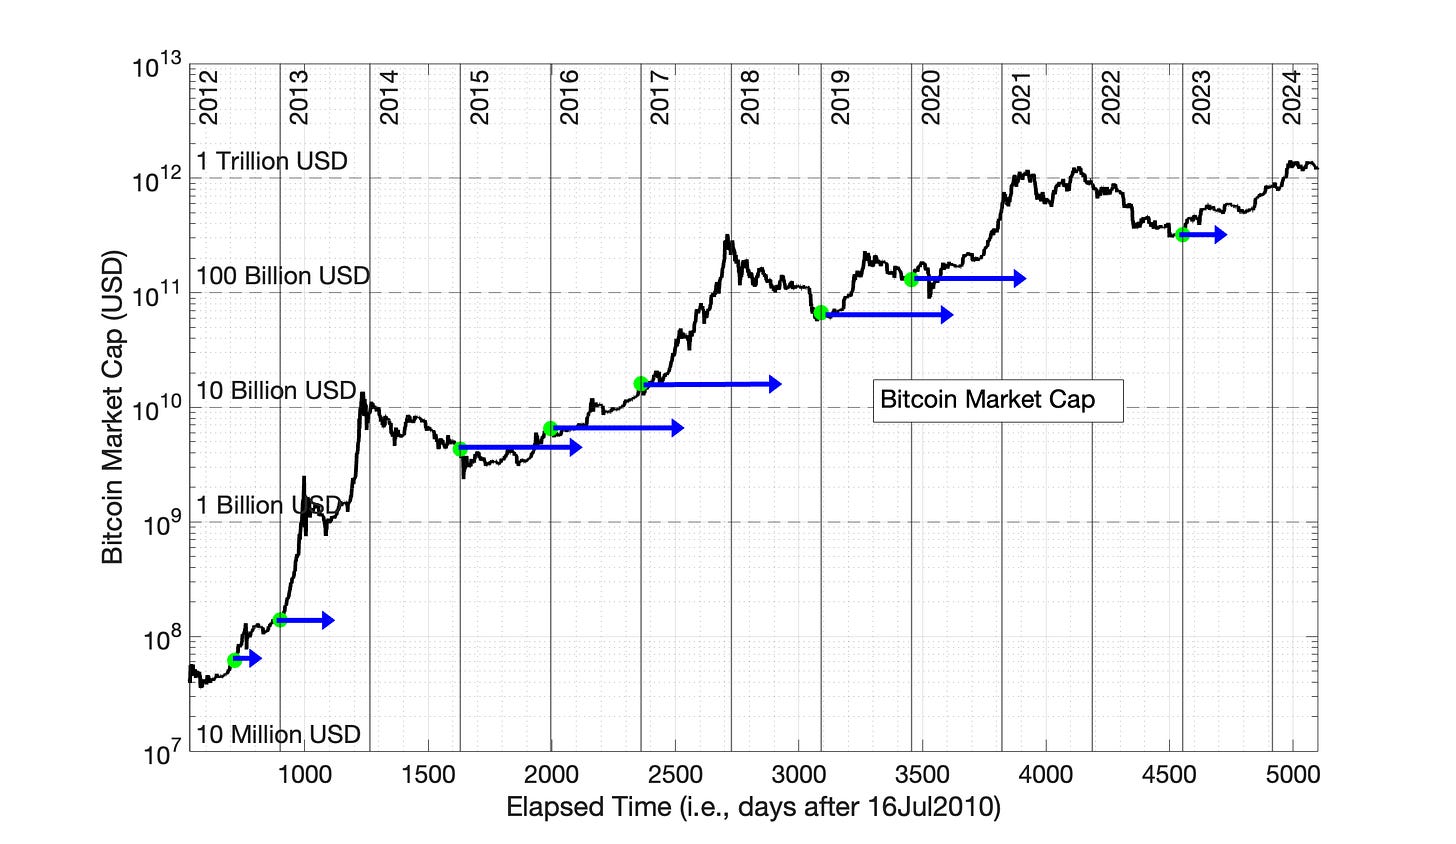
The sequence of Figures 10.1 through 10.6 is repeated in Figures 10.7 through 10.12 for Bitcoin market cap. Eight data points are selected across Bitcoin market cap history in the periods between Bitcoin “bull runs.”
The visual conclusions of Figures 10.7 through 10.12 mirror those of Figures 10.1 to 10.6.
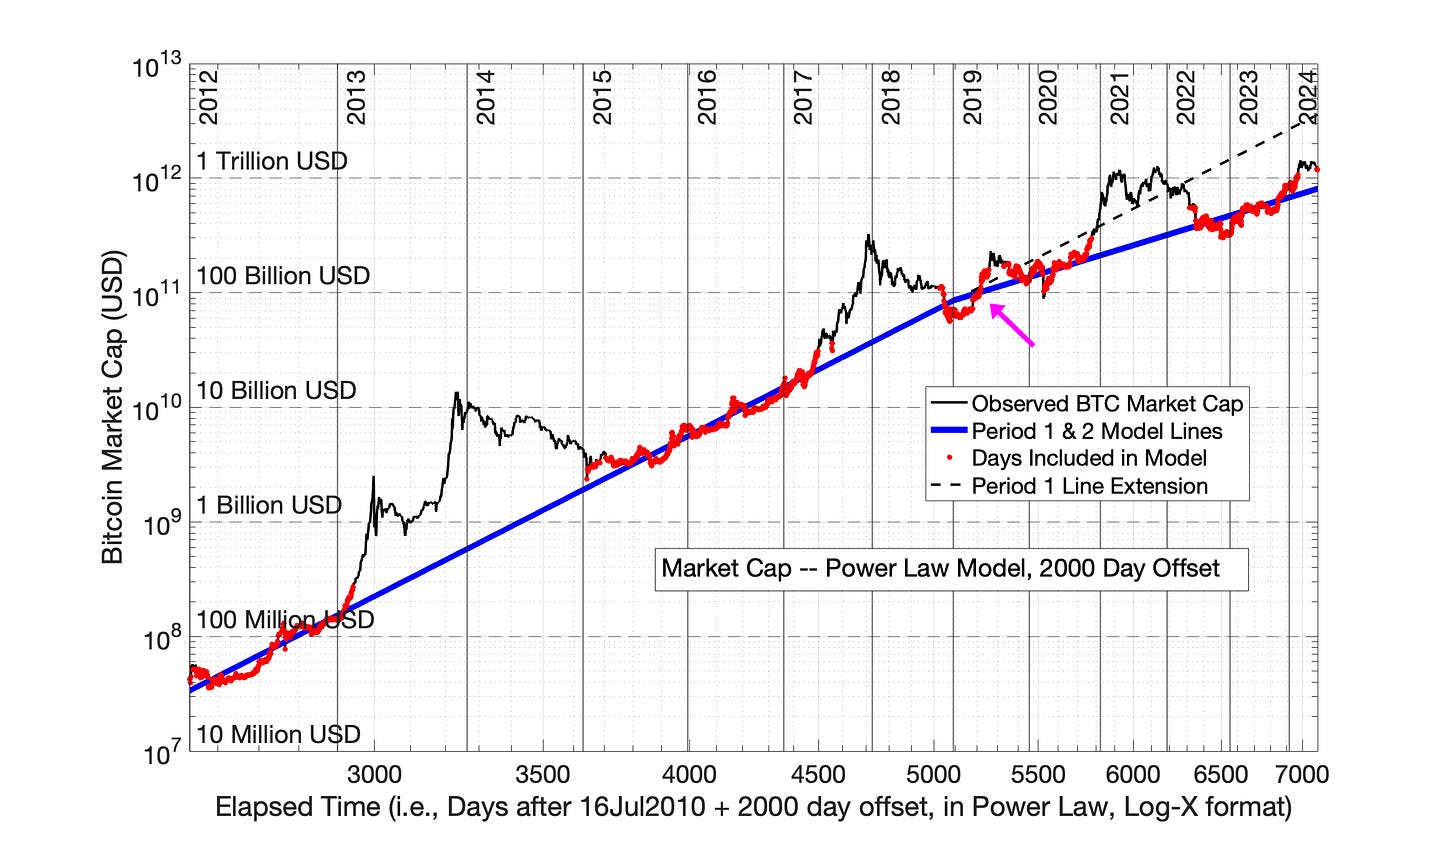
A time offset of 2000 days eliminates discontinuity between Periods 1 and 2 (Fig 10.8).
The horizontal translocation of data points by the Power Law with 2000 day offset is similar to that observed for Bitcoin-containing addresses. (Compare Figures 10.9 and 10.3, and compare Figures 10.10 and 10.4). Application of the Power Law model with 2000-day offset is also discussed in Chapter 9, Figures 9.9 and 9.10.
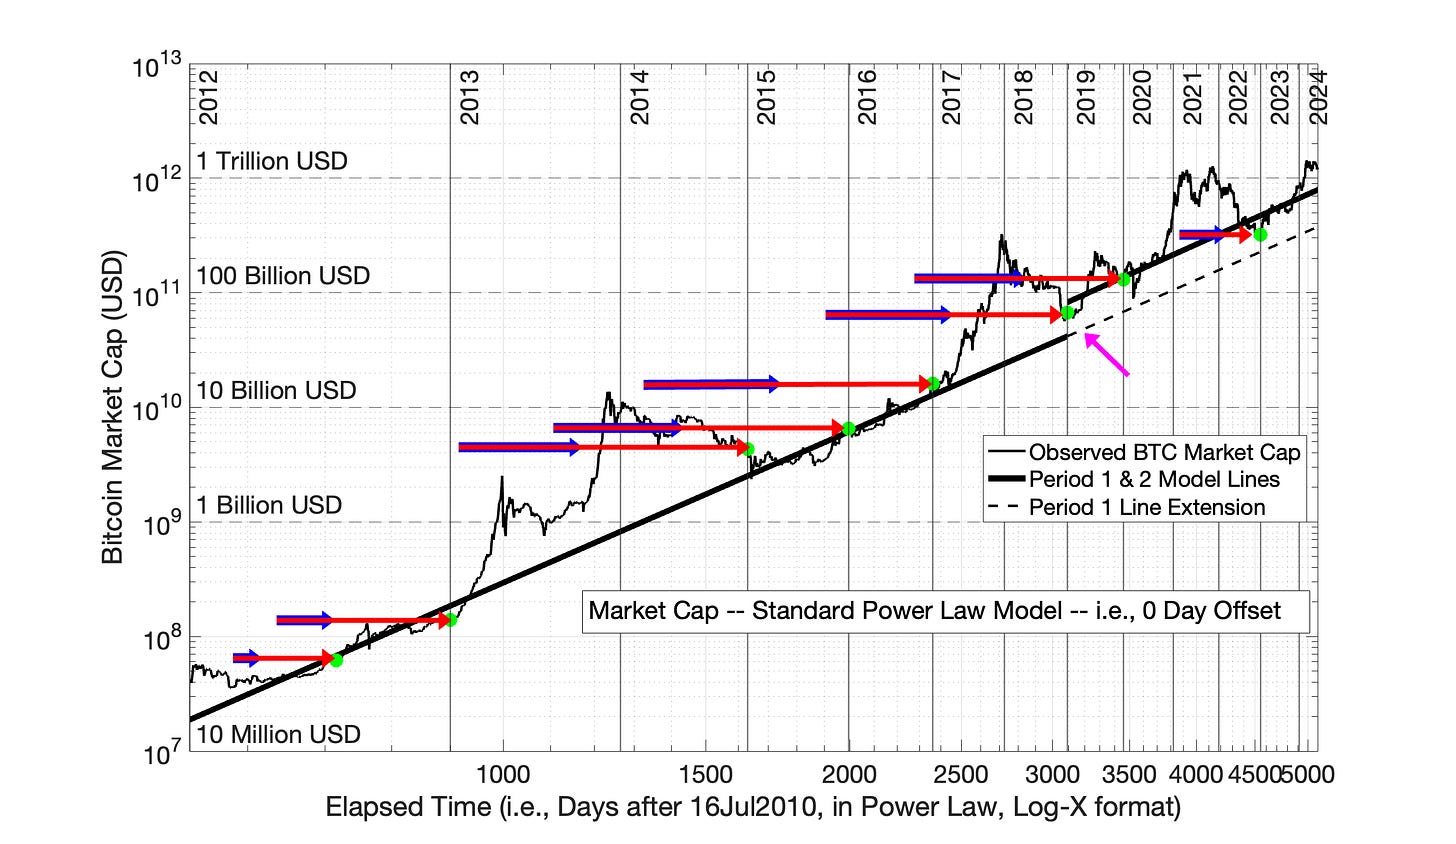
The Power Law with 0 day time offset resulted in much more aggressive data translation to the right which creates significant data distortion and discontinuity between adoption periods ((Compare Figures 10.11 with 10.5).
In Fig 10.12, the Power Law with 560 day offset is shown. With this time offset, the over-translocation of data has been reduced; the data points have retraced about half the distance back to their desired location in Fig 10.10. But, there is still significant data distortion, and discontinuity between Periods 1 and 2.
Additional plots and discussion of the Power Law with time offsets of 0, 560 and 2000 days are presented in Chapter 9.
Fig 10.7 Semilog plot of Bitcoin Market Cap vs. Elapsed Time.
Fig 10.8 Bitcoin Market Cap: Power Law model equation with 2000 day time offset. This is the optimized version of the Power Law model for Bitcoin market cap from Chapter 9 (See Figures 9.9 and 9.10). The Power Law with 2000 day time offset (5.5 years) eliminates the discontinuity between the solid blue lines representing the model equations Periods 1 and 2 (magenta arrow).
Fig 10.9 Power Law Translocation of Bitcoin Market Cap Data Points (2000 Day Offset) Eight data points marked in green are selected across Bitcoin history, in the periods between Bitcoin “bull runs.” The blue arrows indicate the precise translocation of these data points from Fig 10.7 to Fig 10.8 by the Power Law model (with 2000 day time offset).
Fig 10.10 Bitcoin Market Cap: Power Law model equation with 2000 day time offset. This figure is the complement to Fig 10.9. The arrows show the precise translocation of 8 data points from Fig 10.7 to create Fig 10.8. The magenta arrow shows points at the smooth transition of the Period 1 and Period 2 model lines.
Fig 10.11 Power Law Translocation of Bitcoin Market Cap Data Points by the Power Law Model with 0 time offset. The purpose of this figure is to show the excessive translocation of data points by the Power Law with 0 time offset. The blue arrows indicate the translocation observed previously in Figures 10.9 and 10.10 to create the optimal solution (Power Law with 2000 day time offset). The red arrows show the additional translocation created by the Power Law model with 0 time offset. The magenta arrow points at the massive distortion of data points and loss of data continuity created by the Power Law with 0 time offset.
Fig 10.12 Bitcoin-Containing Addresses: Power Law model equation (560 day time offset) Compare this figure to Fig 10.11. The Power Law model with 560 day time offset retains significant data distortion and loss of data continuity relative to Fig 10.10. The length of the red arrows relative to the blue arrows is a measure of the amount of data distortion. The magenta arrow points at the discontinuity between the Period 1 and Period 2 model fits. But, the 560 day time offset has reduced the data distortion relative to the Power Law model with no time offset (Fig 10.11).
10.4 Here’s Why the Popular, Twitter Version of the Power Law Model for Bitcoin Market Cap is Wrong.
The correct application of the Power Law model is Fig 10.8, with a time offset of 2000 days. This plot exhibits two adoption periods, analogous to the two adoption periods observed in Fig 10.2 for the analysis of Bitcoin-containing addresses.
However, the distorted data points in Periods 1 and 2 are nearly aligned in Fig 10.12. The data set of Fig 10.12 invites analysis as if there were was just a single adoption period in Bitcoin market cap history (See Fig 10.13).
Figure 10.13 is very appealing. It suggests Bitcoin is marching forward in an unstoppable manner.
But, the belief in an endlessly linear Power Law model of Bitcoin market cap based on a time offset of 560 days is just an illusion created by a distorted data set.
The apparent alignment of adoption data due to a suboptimal value of Power Law time offset is not common, but has been observed previously in Chapter 7 in the analysis of historic technology adoptions.
Fig 10.13 The Incorrect, Popular Twitter Power Law Model of Bitcoin Market Cap. The Power Law model (with 560 days offset) is applied under the incorrect assumption of a single, linear adoption period from Day 1 (17Jul2010) to Day 5099 (01Jul2024). In fact, Bitcoin market cap exhibited a decline in adoption rate in 2019 (Fig 10.8).
10.5. The Decline in Bitcoin Adoption Rate in 2018/2019 was Inevitable, and is NOT Discouraging.
Bitcoin market cap grew at a blistering pace from 2012 to 2018. This pace was unsustainable. To demonstrate this statement, the future market cap of Bitcoin can be estimated assuming that the trajectory from 2012 to 2018 was maintained.
Using the Period 1 Power Law model formula with an offset of 2000 days from Chapter 9, Section 9.4 we can compute an estimate on 01Jan2034 (Day 8570 of Bitcoin price history).
Model formula: ln(market cap) = 11.24*ln(elapsed time + 2000 days) -70.76
Calculation: ln(market cap) = 11.24*ln(8570 + 2000) - 70.76
Projected market cap = $315 Trillion
Likewise, would could also compute an estimate for that date based on the sister, SRET model for Period 1, from Chapter 9, Section 9.3.
Model formula: ln(market cap) = 0.2428*sqrt(elasped time) + 11.61
Calculation: ln(market cap) = 0.2428*sqrt(8570) + 11.61
Projected market cap = $638 Trillion
By either calculation, these values are astronomical, more than the value of all equities in the world. The Bitcoin market cap was on an unsustainable growth path prior to 2019. A reduction in Bitcoin market cap growth was inevitable at some point in time.
In 2024, Bitcoin market cap has been growing annually at about 40 -50% per year, with the growth rate declining about 1 to 2% per year. This is a very respectable growth rate for any investment.
Note:
The Power Law model (with 2000 day offset) and the SRET model are closely aligned in modeling Bitcoin market cap for the period from 2012 to present (See Chapter 9, Fig 9.11), but the underlying functions of the two models have different shapes when extrapolating into the future.
The extrapolation of either of these models into the future is fraught with risk. Most historic technology adoptions have faced at least 3 or 4 changes in adoption slope during their history (Chapters 6 and 7). Any significant extrapolation of these model equations into the future must recognize that the next change in Bitcoin market cap adoption slope may have already begun.
10.6 Conclusion
An argument has been advanced that there was a significant 2018/2019 decline in the growth rate of both Bitcoin network size (as inferred from the Bitcoin-containing address metric) and Bitcoin network value (i.e., market cap).
And, a strong argument has been presented that the popular, “Twitter” version of the Power Law is wrong. This model wrongly claims that Bitcoin has been growing since 2010 in a single adoption period. The reason for the flaw in the Twitter Power Law model is an inappropriate Power Law time offset of 560 days.
Note: For a detailed summary of the data and analyses presented in this Chapter, see Chapters 6, 7, 8, and 9.
10.7 Data Sources and Analysis
Bitcoin network data in this chapter are provided by the cryptocurrency analysis provider Glassnode (www.glassnode.com), as part of an “Advanced” membership plan at about $30/month.
Day 1 of Bitcoin price and market cap history in the Glassnode database is 17Jul2010. The Glassnode daily market cap and Bitcoin-containing address counts are numbered from Day 1 through Day 5099 (July 1, 2024). The period of primary focus is Day 534 (01Jan2012) to Day 5099.
Data analyses and preparation of figures were performed using Matlab (www.mathworks.com).
10.8 About the Author
The author has a B.S. and PhD. In chemical engineering. His PhD thesis focussed on mathematical modeling, simulation, and implementation of process control. Following his PhD, he was a university professor for 10 years at two US universities, focusing on both research and teaching. At both universities he taught the required chemical engineering course in process modeling and control. He subsequently spent more than 20 years in industrial chemical engineering practice.


